What is The Vistorian?
The Vistorian is an online platform that provides interactive visualization for various kinds of networks. It is a collaborative open-source research-project currently in the prototyping phase.
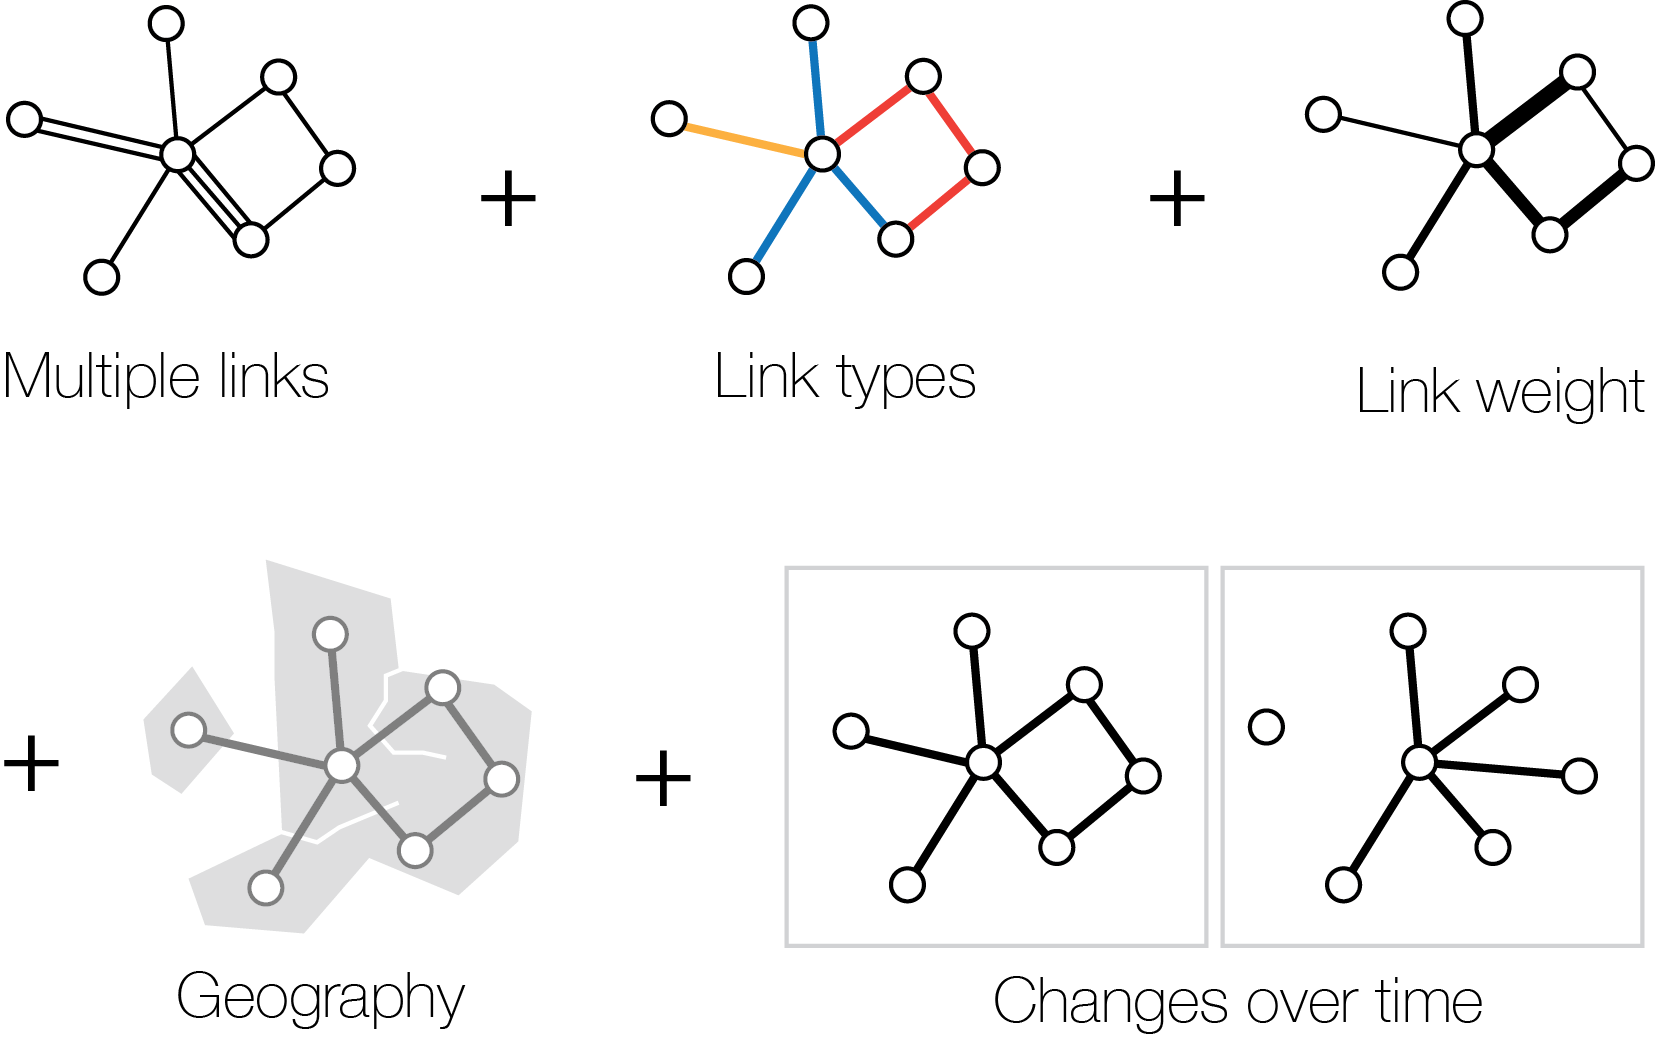
Enter your data once, and explore it using various visualizations.
Use
The Vistorian is both- a javascript library called networkcube.js for importing, storing, and querying dynamic networks in your browser cache,
- a set of online visualizations build on top of that library, and
- a ready-to-use web application (this website).
- start using this website by creating my session (no registration required) and start importing your data. Data gets stored in your browser's cache,
- build your own website/webapp using networkcube.js and include our visualizations through a simple call to the API,
- write your own visualizations on top of network and provide their URL for others to integrate, and
- help us improving the visualizations and the core-functionality of networkcube
Stay updated and discuss with us
Join our mailing list to get updates on the project and post questions to the forum: https://groups.google.com/forum/#!forum/vistorian/joinContribute
Networkcube and the underlying library are open source. For getting involved, visit https://github.com/networkcube/networkcube and e-mail us.Current and past contributors
Benjamin Bach, Edinburgh University, UKJean-Daniel Fekete, Inria
Nathalie Henry Riche, Microsoft Research
Nicole Dufournaud, EHSS, France
Roland Fernandez, Microsoft Research
Charles Parker, Microsoft Research
Rick Guiterrez, Microsoft Research
Paola Llerena Valdivia, Inria
Emmanouil Giannisakis, Inria
Related Projects
NodeXLRepublic of letters
Standford's Palladio
Import data
Your data must be formatted in CSV data tables.. Data is imported into your browser, but neveer to any server. Deleting the browser cache, deletes your data.
Follow the link below to resume your last session or start a new one to import data.
Data
Currently, data has to be formatted as shown below. Each row specifies a link in the networks. The two mandatory fields in this example are Name 1 and Name 2, specifying start and end node. Header names are up to the user and will be specified once the data is uploaded. Further importer functions are work-in-progress. Download example data
Learn more about data formatting and data schemas in networkcube.
Learn
Overview video (the video still shows the old project name Networkcube. However, both are identical.Manual
Interactive visualizations
Demo session
Cite
Benjamin Bach, Nathalie Henry Riche, Roland Fernandez, Emmanoulis Giannisakis, Bongshin Lee, Jean-Daniel Fekete. NetworkCube: Bringing Dynamic Network Visualizations to Domain Scientists. Posters of the Conference on Information Visualization (InfoVis), Oct 2015, Chicago, United States. 2015.
@misc{bach:hal-01205822,
  TITLE = {{NetworkCube: Bringing Dynamic Network Visualizations
  to Domain Scientists}},
  AUTHOR = {Bach, Benjamin and
  Henry Riche, Nathalie and
  Fernandez , Roland and
  Giannisakis, Emmanoulis and
  Lee, Bongshin and
  Fekete, Jean-Daniel},
  URL = {https://hal.inria.fr/hal-01205822},
  NOTE = {Poster},
  HOWPUBLISHED = {{Posters of the Conference on Information
  Visualization (InfoVis)}},
  YEAR = {2015},
  MONTH = Oct,
  KEYWORDS = {information visualization ; networks ;
  social networks ; brain connectivity},
}



 Visualizations
 Demo
Demo Visualization Manual
 Data Formatting
 Github
 Contact




 © 2016 INRIA